Part I: How not to structure your database-backed web apps
Most scientific papers are unlikely to change your day-to-day approach as a Rails web developer. How not to structure your database-backed web applications: a study of performance bugs in the wild Yang et al., ICSE'18 is the exception to that rule.
This study examined 12 popular, mature, opensource Rails apps for ActiveRecord performance anti-patterns. And boy, did they find some issues:
11 out of 12 studied applications contain pages in their latest versions that take more than two seconds to load and also pages that scale super-linearly
I'm not shocked that almost every application had problematic controller-actions. I was
In total, there are 40 problematic actions identified from the top 10 most time-consuming actions of every application. Among them, 34 have scalability problems and 28 take more than 1 second of server time.
That means one-third of controller-actions doing significant traffic are problematic😲. Wow.
Database performance woes aren't solved once, like forgetting to gzip an HTTP response body. They appear in new ways as more data, more users, and more features are added to an app.
In this post - the first of a two-part series - I'll show how to use Scout to quickly identify your own app's problematic controller-actions using similar reasoning as this study. In the next post, I'll show how to recognize ActiveRecord performance anti-patterns using Scout. In other words, we'll start with the forest, then look at the trees.
What is a problematic controller-action?
The paper defines a controller-action as problematic if:
The controller-action is among the top 10 most time-consuming (response time * throughput) AND (spends more than 1 second on the server side OR performance grows
In short, the paper categorizes problematic endpoints as those with performance issues (slow, on average), scalability issues (response time grows linearly or worse with the size of the data), or both.
Identifying problematic controller-actions
Install Scout
If you don't have a Scout account, signup for our 14-day free trial and install + configure the scout_apm
Identify your time-consuming controller-actions
To start, change the timeframe in Scout to at least 1 day:
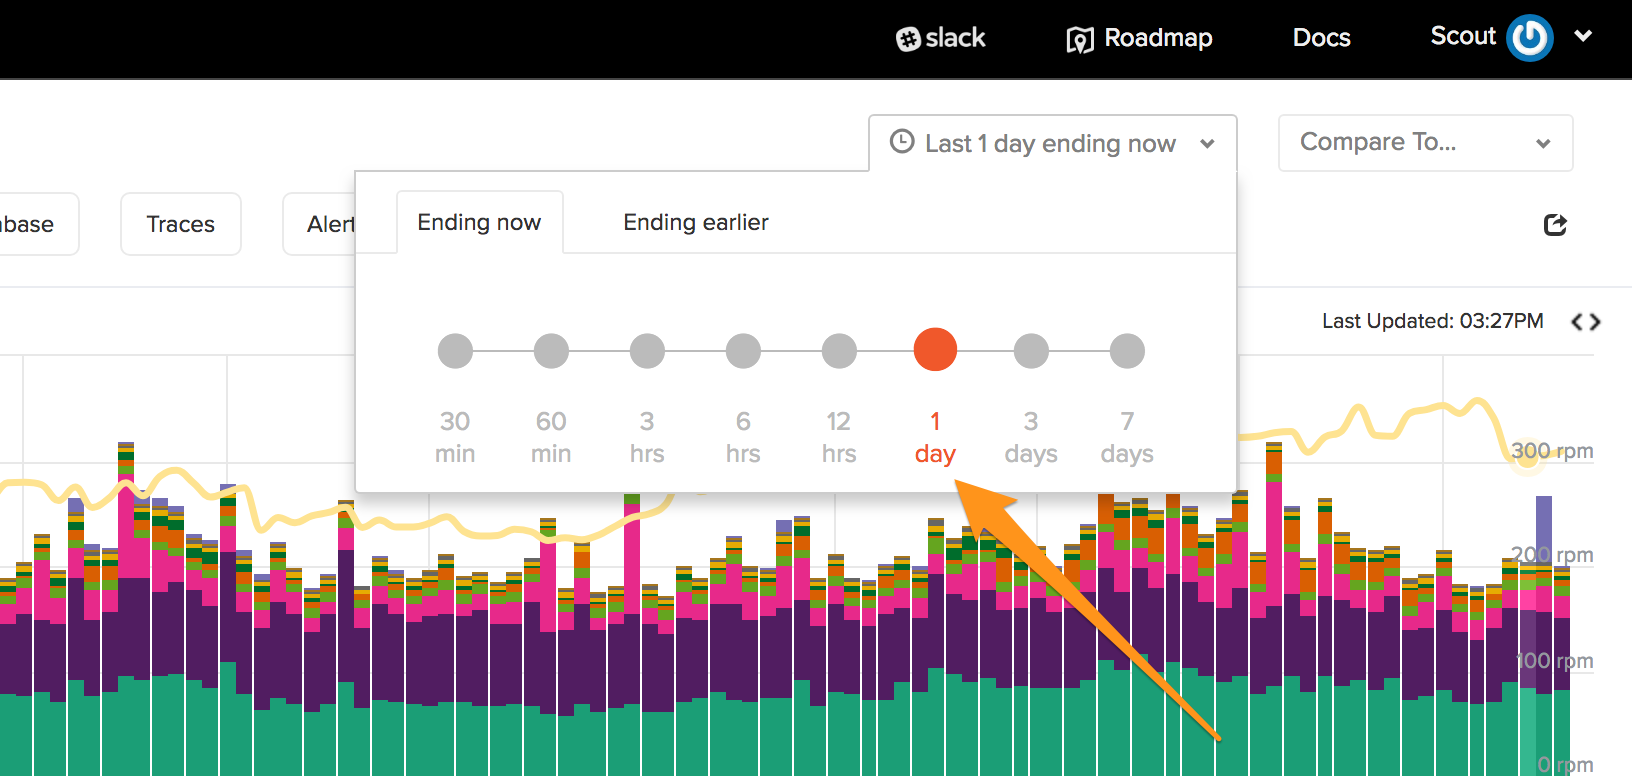
This ensures a small blip over a short timeframe doesn't send us down the wrong track.
Next, navigate to "Web Endpoints". By default, Scout already sorts your controller-actions by "Time Consumed". If you've changed the sort order, just click on "Time Consumed" to sort by this metric:
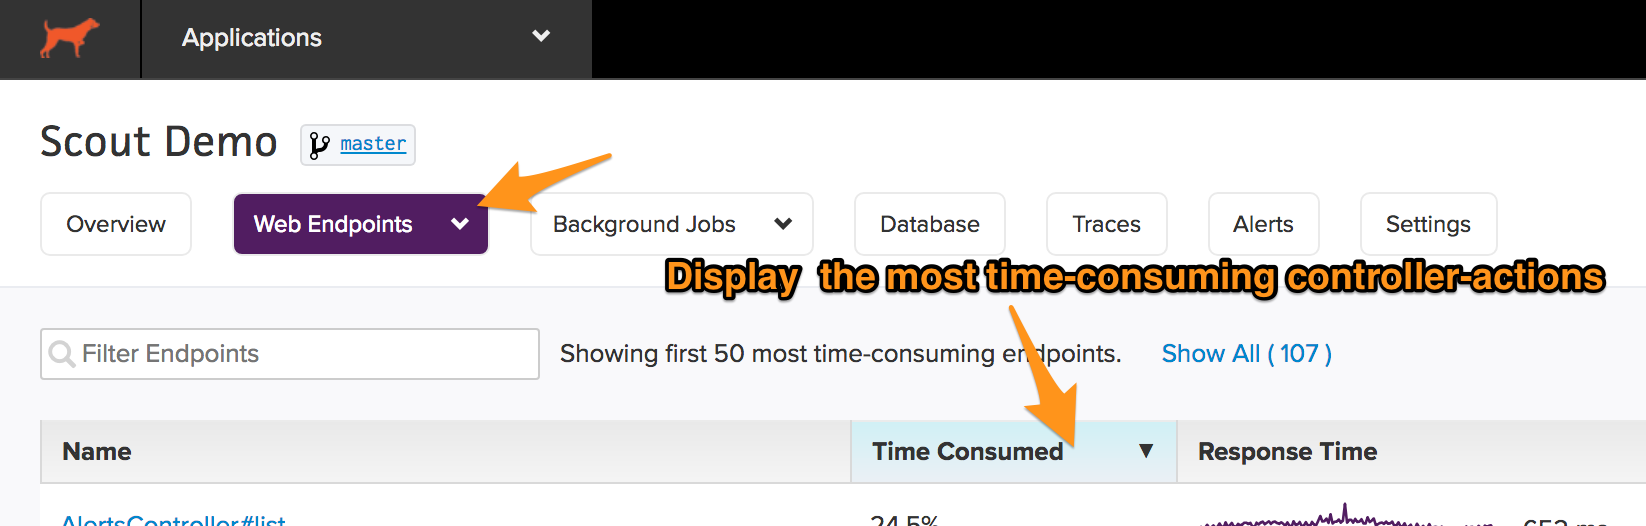
Done. Of the 107 unique controller-actions that handled traffic, I've filtered down to just those consuming a significant amount of time.
Identify controller-actions with performance issues
The paper defines slow controller-actions as those with response times of at least 1 second. By examining the list of controller-actions, I see two controller-actions that

Identify controller-actions with scalability issues
It was easier for the paper's authors to identify controller actions with scalability issues than it will be with your app. A production application used by many users, each storing different amounts of data in your app has significantly more noise than a controlled experiment. For example, in Gitlab (one of the apps in the study), the distribution of projects by
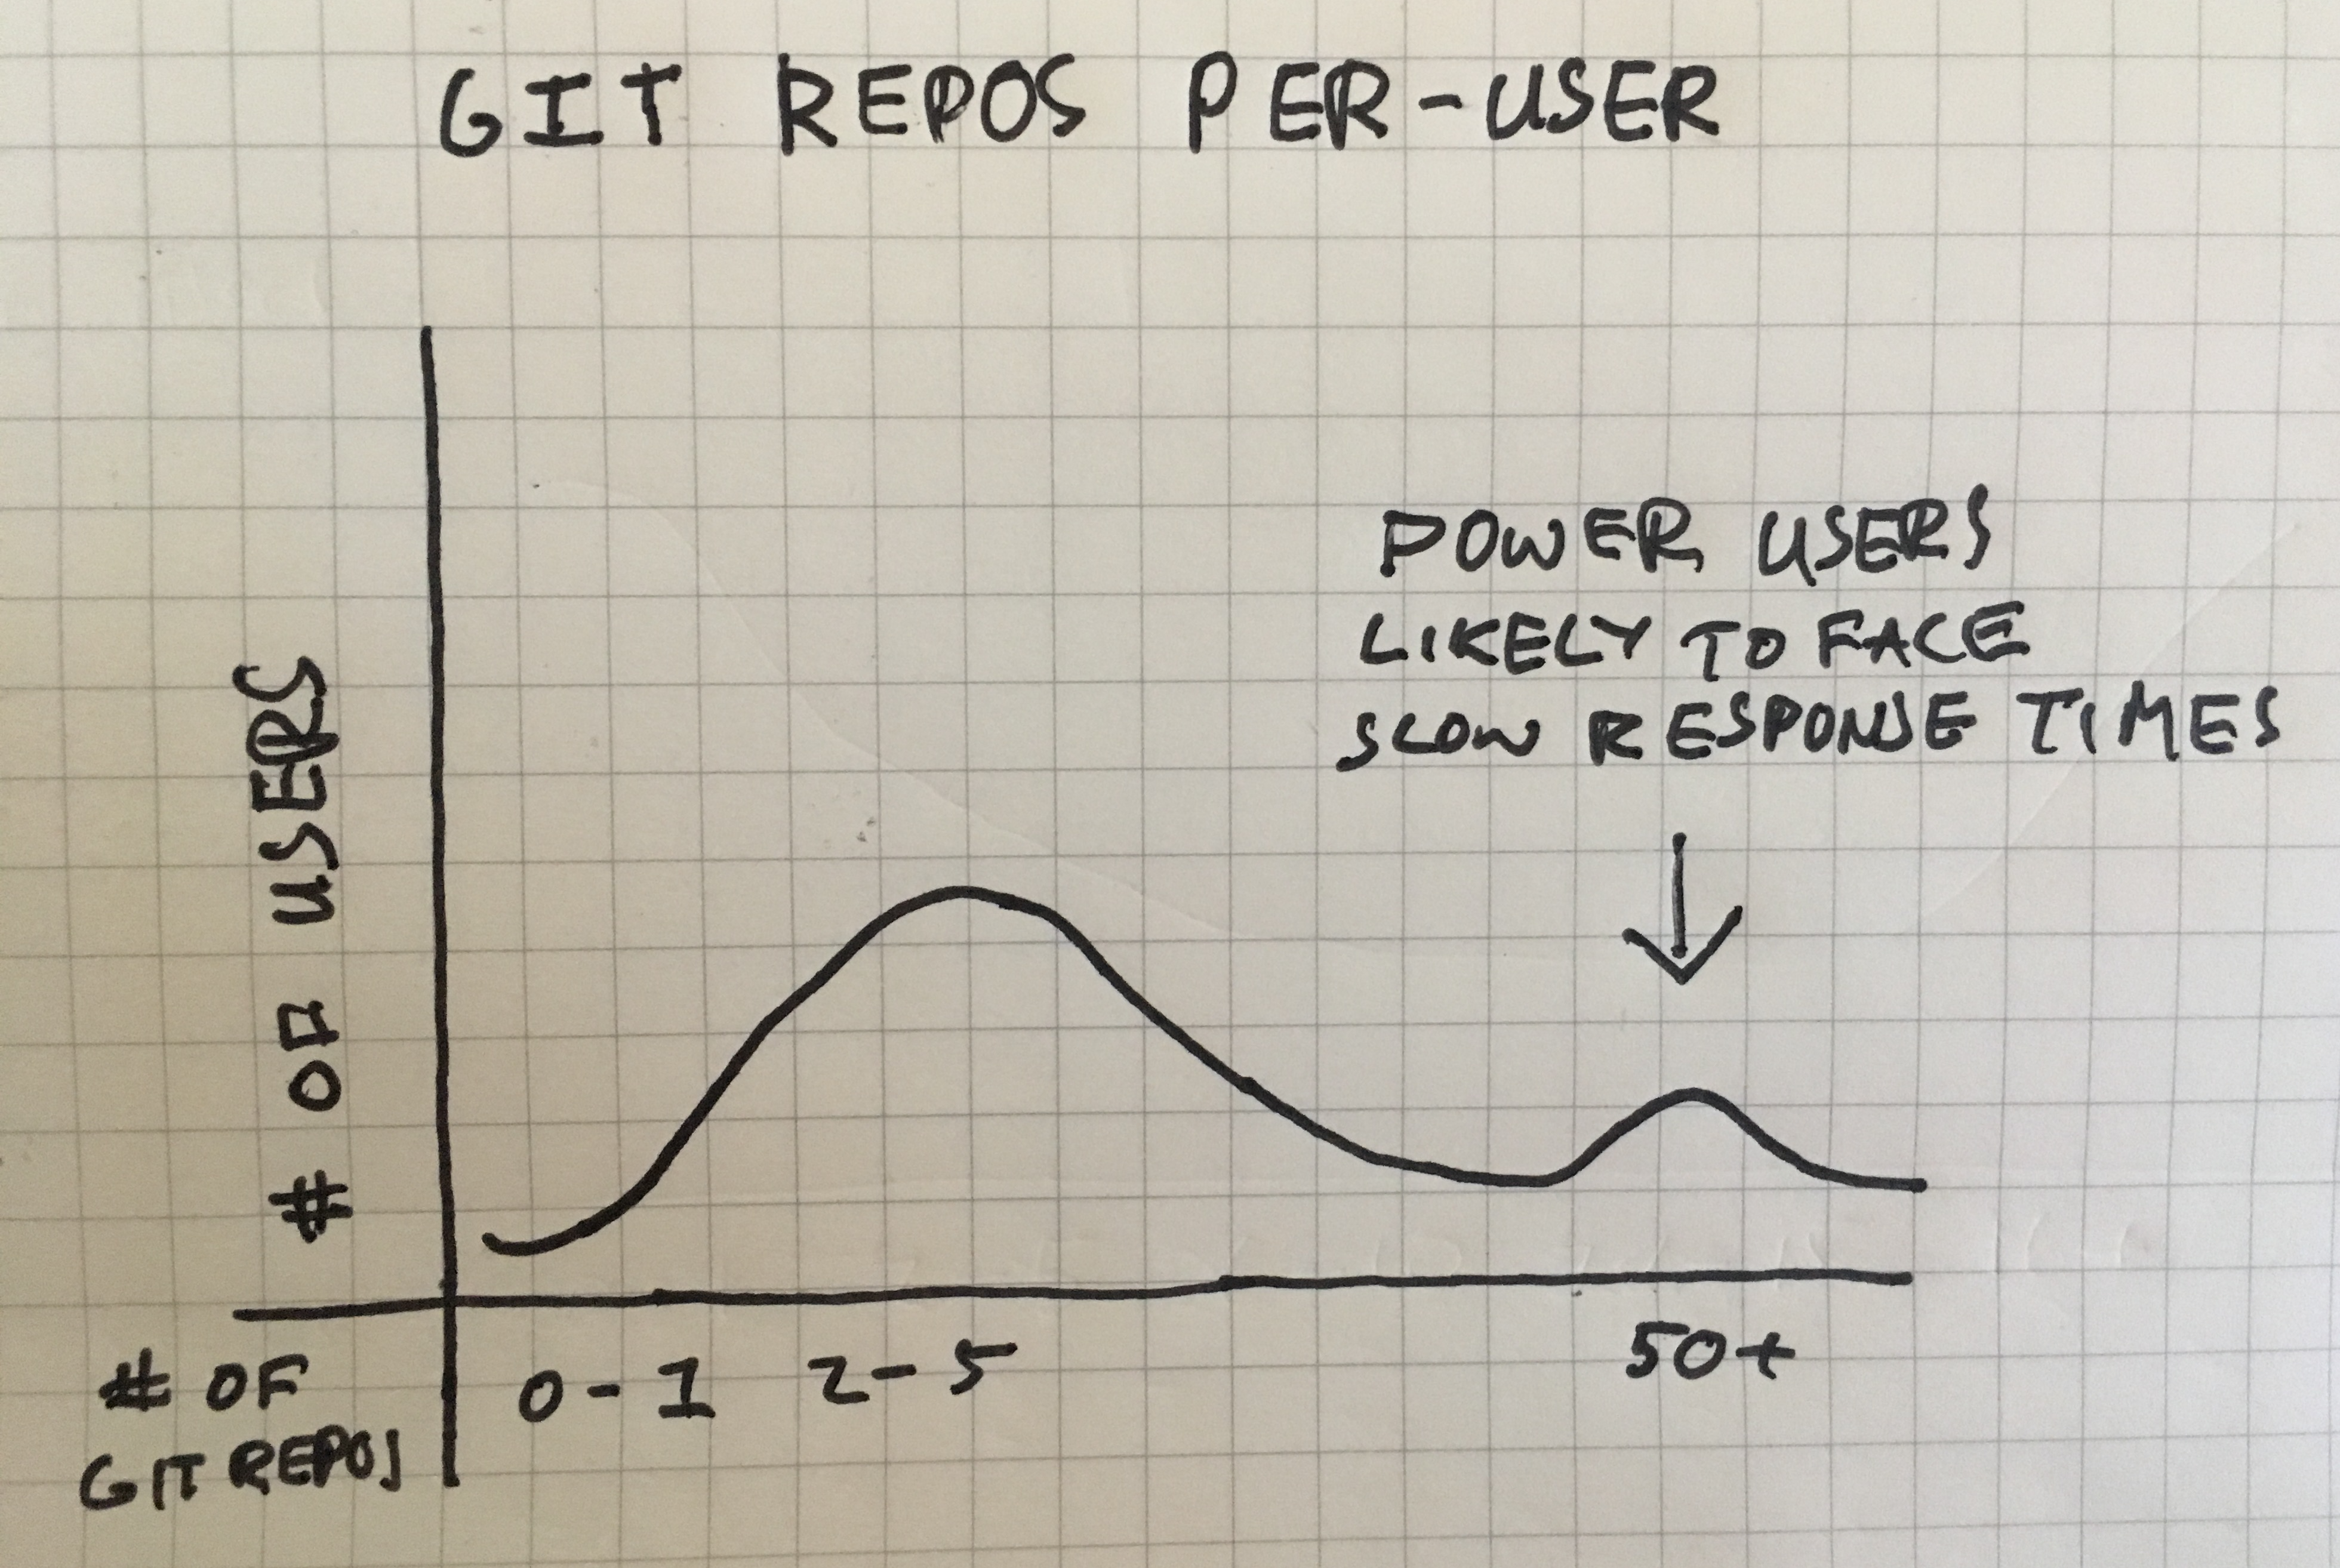
It's unlikely that a scalability issue causes a performance issue for everyone all at once. Instead, power users (those with more data) are likely to hit these issues first. Scalability issues often look less like a slowly worsening performance profile and more like a histogram with an unnatural distribution (ex: always slow for a particular URL path, fine for others).
To uncover scalability issues, use Scout's Trace Explorer. Scout's Trace Explorer allows you to filter individual transaction traces collected by the agent in realtime (ex: select just those traces triggered by a specific user). Here's Trace Explorer in action:

You can add custom context that is relevant to your Rails app with Scout's simple API. Some likely candidates: the id of the current user, their monthly spend, and the id of their parent organization.
Of this app's 1,000 slowest transaction traces, over 25% are triggered AlertsController#list
I'll filter data to just this controller-action and see if there's an unnatural spread of requests across any particular dimensions. To filter, I simply click AlertsController#list

Performance isn't randomly slow. Instead, it's possible that these three
After exploring the rest of the controller-actions with the
- AlertsController#list
- InsightsController#slow_query
- AppsController#show
- EndpointsController#show
Summary - our problematic endpoints
Of the top 10 most time-consuming endpoints, we have the following problematic endpoints:
- AlertsController#list (scalability)
- InsightsController#slow_query (performance, scalability)
- EndpointsController#show (scalability)
- AppsController#show (performance, scalability)
- EndpointsController#data (scalability)
This is very close to the average number per-app in the study, which found an average of four problematic controller-actions per-app. This filtering is very important: this app has more than 100 controller-actions receiving traffic. Almost every endpoint has some optimization potential, but we want to focus our efforts. Focusing on five endpoints is a lot easier than randomly knocking out issues.
Next Up
Now that we've identified our problematic controller-actions, its time to use Scout to identify any ActiveRecord anti-patterns we've unintentionally implemented. Stay tuned for part 2.