Tutorial: Distributed Tracing in Ruby with OpenTracing

It's a lot harder connecting the dots of the request lifecycle when the final response is built from a number of separate microservices.
However, distributed tracing - which connects a transaction trace across microservices - is getting a lot easier. In this short tutorial, I'll show how to add distributed tracing to your Sinatra web apps via OpenTracing, a vendor-neutral tracing API, and Jaeger, an opensource distributed tracing system.
OpenTracing, a vendor-neutral tracing API
Enter OpenTracing, a vendor-neutral open standard for distributed tracing. OpenTracing loosens the chains on tracing instrumentation: if we trace our method calls via OpenTracing APIs, we can swap out our tracing vendors just like logging and metrics!
To date, there are a number of services capable of ingesting transaction traces generated via OpenTracing. In this quick tutorial, we'll capture transaction traces from two Sinatra apps, and view these traces with Jaeger, an open-source distributed tracing system.
The setup
This tutorial will use the following parts:
- The Jaeger All-in-one Docker image - lets us view our distributed traces locally.
- Two minimal Sinatra applications.
- The rack-tracer Ruby gem - traces requests to our Sinatra apps. I'm using version 0.3.0.
- The jaeger-client Ruby gem - a Jaeger OpenTracing Tracer that sends traces to the Jaeger collector. I'm using version 0.4.1.
Installing Jaeger All-in-one

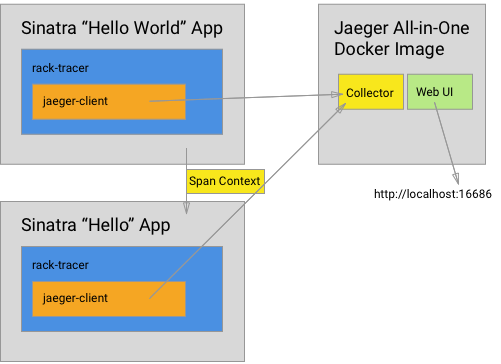
The Jaeger All-in-one Docker image is designed for quick local testing. It launches the Jaeger UI, collector, query, and agent, with an in memory storage component. The jaeger-client gem installed in our Sinatra app sends traces to the collector on this running Docker container. Traces are then viewable in the web UI, accessible via http://localhost:16686.
You can install and run Jaeger All-in-one via the following command (assuming Docker is installed on your machine):
docker run -d -e COLLECTOR_ZIPKIN_HTTP_PORT=9411 -p5775:5775/udp -p6831:6831/udp -p6832:6832/udp \
  -p5778:5778 -p16686:16686 -p14268:14268 -p9411:9411 jaegertracing/all-in-one:latest
Verify that the Web UI is accessible at http://localhost:16686. Now that Jaeger is running, let's setup our first Sinatra app.
Sinatra App No. 1: "Hello"
We'll setup a basic Sinata application that simply returns "Hello" when accessed via http://localhost:4567. I've already included the OpenTracing bits:
In the same folder of the hello.rb Sinatra app, add a Gemfile:
Run bundle then start the app: ruby hello.rb.
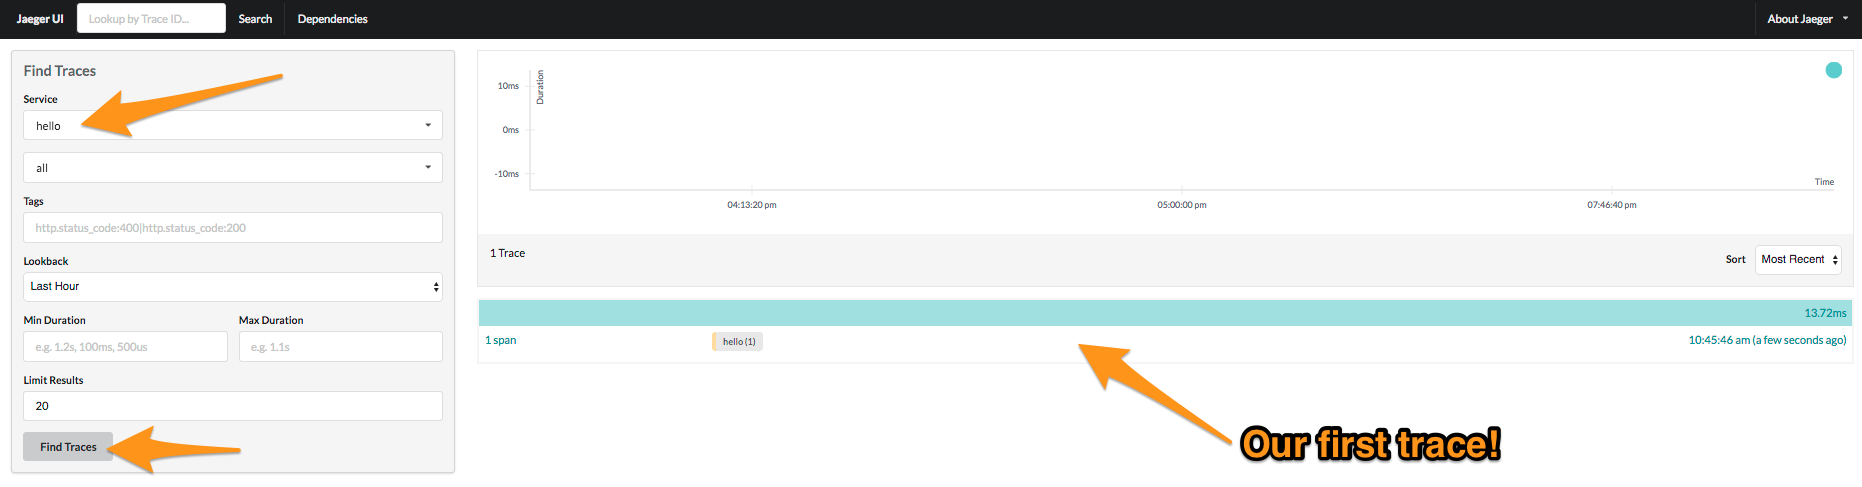
Collect our first trace
Send a web request to http://localhost:4567. Wait a moment, then navigate to http://localhost:16686, select the "hello" service, and click the "Find Traces" button. You should see your first transaction trace!
Sinatra App No. 2: "Hello World"
Our second Sinatra app will send a request to the "Hello" Sinatra app to help render some text. Via the magic of OpenTracing, we'll see the entire lifecycle of the request across both the parent app ("Hello World") and our simple microservice ("Hello").
Here's that second app:
Start the app: ruby hello_world.rb -p4570. This will start the second app on port 4570.
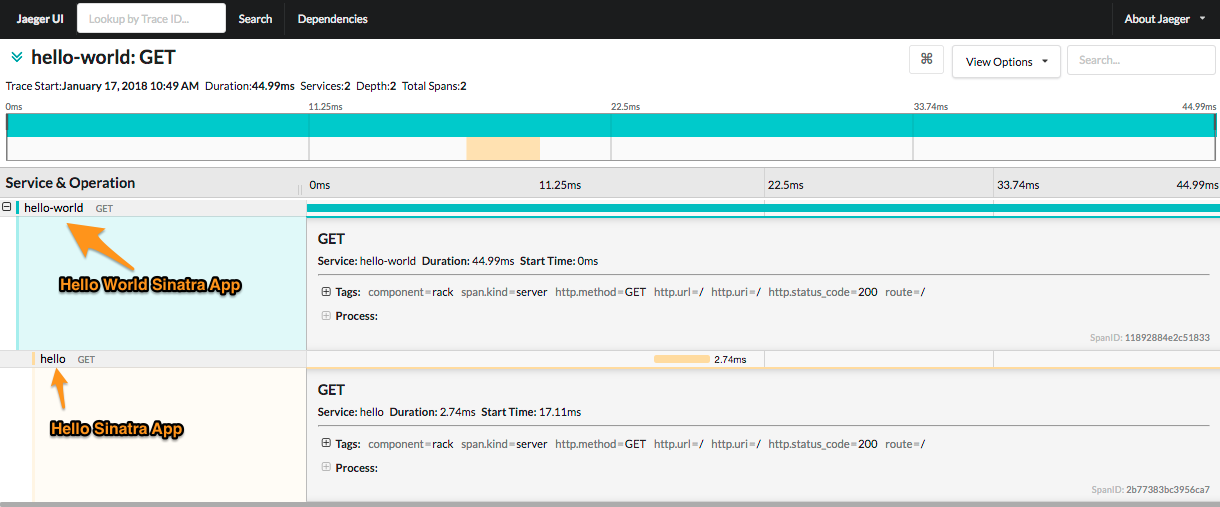
Collect our first distributed trace
Send a web request to http://localhost:4570, wait a moment, then refresh http://localhost:16686. Inspect your most recent, richer trace:
How did the distributed trace magic happen?
The "Hello World" app returns a string that contains text from the "Hello" app. How did OpenTracing capture the entire lifecycle of this request in a single transaction trace?
OpenTracing defines a standard for tracing across process boundaries. There are two parts:
Tracer#inject- injecting theSpanContextinto the the headers of the request we're sending from the "Hello World" app.Tracer#extract- extracting theSpanContextfrom the incoming request in the "Hello app".
We're manually injecting the SpanContext via a request header prior to sending the request to the "Hello" app:
OpenTracing.inject(env['rack.span'].context, OpenTracing::FORMAT_RACK, req)
Jaeger::Client::Tracer#inject sets an uber-trace-id request header that contains all of the context from the current span to propagate the trace to the "Hello" service.
When the "Hello" app receives the request, the middleware installed by the rack-tracer gem extracts this information.
Summary
With a couple of pieces, we've added vendor-neutral, distributed tracing to our Ruby web apps via OpenTracing. We can view these traces with Jaeger, an open-source distributed tracing system. If we'd like to use a tracing system other than Jaeger at some point, we can swap out the tracer by changing a single line of code in our Sinatra apps.