A tour of Python monitoring tools
Prior to releasing our Python Performance Monitoring agent, we took a look at the Python ecosystem to see how Scout can compliment the existing landscape. What follows is a summary of our internal report.
The Python ecosystem has a wealth of monitoring tools. That said, making sense of each tool's specialty - and where overlaps exist - is a challenge.
In this post, I hope to give a clear picture of the different monitoring and debugging tools available in the Python world and explain how they fit together.
Before we talk about specific tools, lets talk about how to categorize them.
Categorizing Monitoring Tools
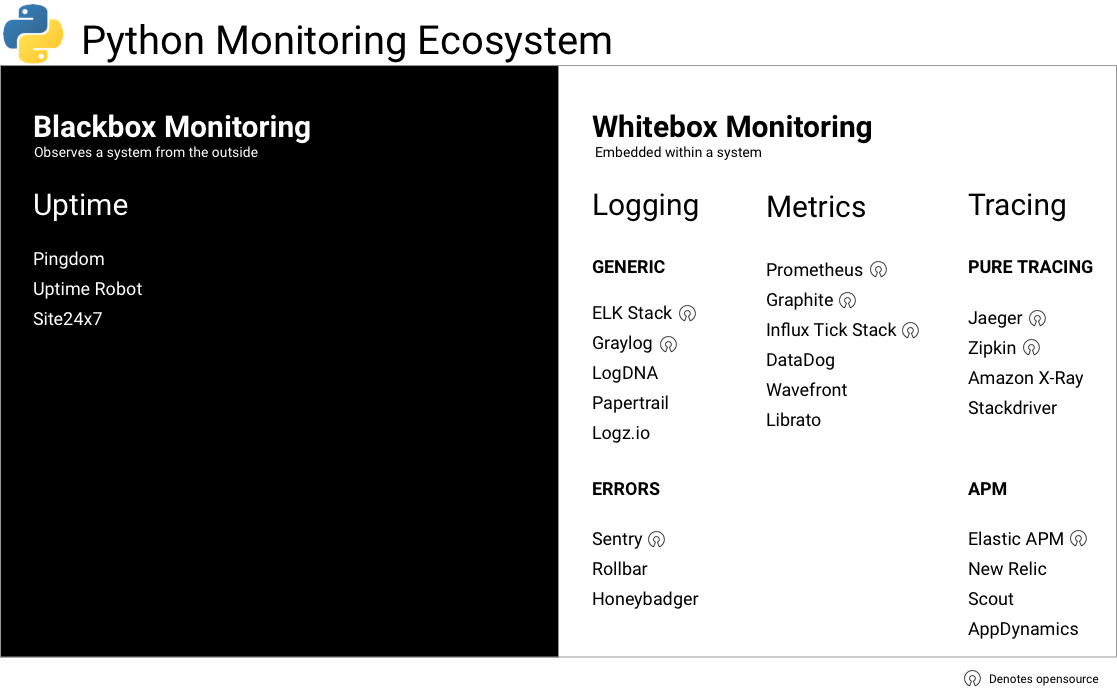
Here's how I roughly sort monitoring tools (click image for full-size):
Note that some tools cross boundaries. For the tools in this post, I've included their primary area of focus.
Logging
Logging is the lowest common denominator of monitoring: I'd wager every Python app uses it in some form. For newly launched, lower traffic apps, there's nothing wrong with logging to a file. Once your app traffic grows - especially if it begins to serve requests across multiple app servers - you'll want to start thinking about aggregating your logs and making them easily filterable.
There are both opensource, self-hosted and SaaS available for log aggregation. Additionally, error monitoring is a subset of logging. Error monitoring tools provide rich data - including backtraces - when your app throws an exception.
Opensource Log Aggregation
- Generic Logs
- The ELK Stack - Elasticsearch, Logstash, and Kibana combine to form the ELK stack. Here's a tutorial for Django apps.
- Graylog - Very similar to the ELK stack. Some developers find the UI easier to work with.
- Error Monitoring
Here's a comparison of the ELK stack and Graylog.
Hosted Log Aggregation
Here's a few of the many the options:
- Generic Logs
- LogDNA
- Papertrail - simple UI, lacks machine-readable logs.
- Logz.io - ELK as a Service
- Error Monitoring
Metrics
I like to think of metrics as aggregated log events. There are a number of options for storing metrics emitted from a Python app based on StatsD or a StatsD-like client.
Opensource Metrics
Hosted Metrics
Tracing
Transaction tracing provides a map that illustrates the lifecycle of a single Django web request, Celery task, etc. Data from transaction traces can be aggregated to generate higher-level metrics: these traces form the foundation of Application Performance Monitoring (APM) tools. Some tools just collect and display sampled transaction traces while others provide both traces and overall application metrics.
Unlike logging and metrics - where vendors can easily be swapped out - transaction tracing has traditionally lacked an open standard. At Scout, we've recently released an MIT-licensed APM agent for Python Performance Monitoring.
Opensource Tracing
- Pure Tracing
- APM
Hosted Tracing
- Pure Tracing
- APM
Uptime
After logging, uptime monitoring is perhaps the next monitoring tool required by sites small and large. While self-hosted, opensource tools do exist for this, I've decided to only list the hosted options as the price point for these is so low.


