NEW! Request queuing and middleware instrumentation
Metrics for Christmas everyone! Get your metrics! We've added more metrics to Scout App Monitoring. These metrics will give you even greater visibility into the full request cycle of your Rails app:
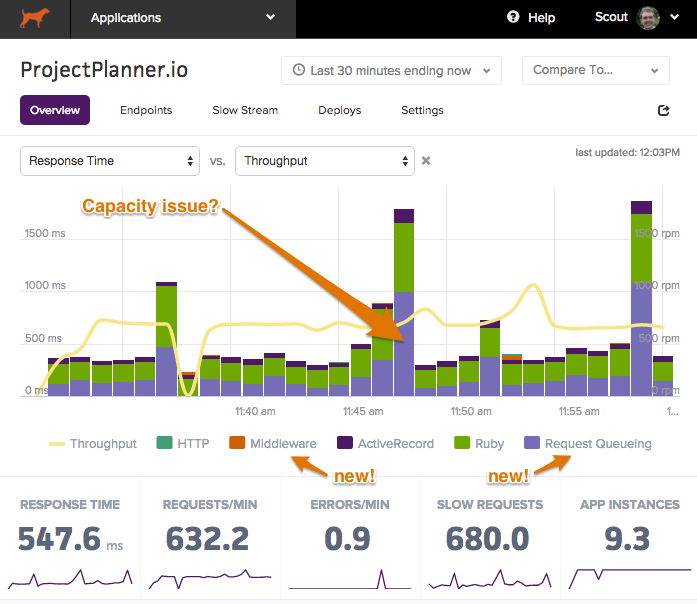
- Request Queuing - judging if you have enough capacity to serve all your traffic is one of the more difficult (and important) things to track. Measuring the time spent from when a request first hits your load balancer till when your Rails app starts handling the request is a big help. Large request queuing times means traffic is piling up waiting to be served.
- Middleware instrumentation - we now instrument the middleware used in your app as well.
Additionally, we addressed a couple of quirks:
- Slow requests were timestamped with the time the request started. Now, they are timestamped with the time the request COMPLETES. This aligns with how other tools (like MySQL slow query logs) handle logging slow method calls.
- Addresses some skewing issues where metrics may be associated with a time slot a minute-or-two off the actual time.
- The old agent required a
config/scout_apm.ymlfile even if environment variables were used. The file is no longer needed. Issues with this mostly sprang up in CI systems. - Solidifying support for threaded app servers (such as Puma or Thin).
We're excited about this agent update. It lays some terrific groundwork for future enhancements.
Upgrade instructions
Update your Gemfile:
gem 'scout_apm', "~> 1.2.0"
bundle, push, and deploy!
Request Queuing Configuration
If you don't see request queuing metrics after upgrading, your upstream load balancer/web server likely isn't setting the required HTTP header to support this. See our docs for more info.
Help?
Just reach out to support@scoutapm.com and we'll get you squared away.


