Introducing easy StatsD with Scout
The easiest way to unleash StatsD.
One agent. Minimal overhead. Robust language support. A unified monitoring solution for your servers and metrics.
We've added StatsD support to our monitoring agent. With Scout, you are just minutes away from StatsD-backed charts and alerts. Use StatsD to report code execution times, user signup rates, and more.
StatsD generated metrics are first class citizens in Scout - coexisting with every metric available via Scout.
Don't just take our word for it, Scout customer Martin Kelly had this to say:
It took about an hour to get all of our prod and preprod custom metrics into Scout and displayed on our dashboard. Both the client and project manager were very happy!"
Why StatsD + Scout?
Prior to today, all metrics in Scout were generated by our agent (monitoring system resource usage) or plugins (monitoring services). This works great for sampling metrics, but it's not a great fit for event-based metrics (ex: tracking user signups, response times, etc).
StatsD is a great fit for event-based metrics, but rolling your production-grade setup for StatsD is involved. We also want to see all of our metrics (and configure alerting) from a single app.
We tested StatsD+Scout internally first, loved it, and rolled out to customers during a preview stage. Today, StatsD is battle-tested and ready for your metrics.
Quick tip: replacing metric logging with StatsD
First time with StatsD? Here's a tip: if you are logging a metric, it probably makes more sense to send it StatsD.
Example:
logger.warn "Error Occurred!"
...becomes:
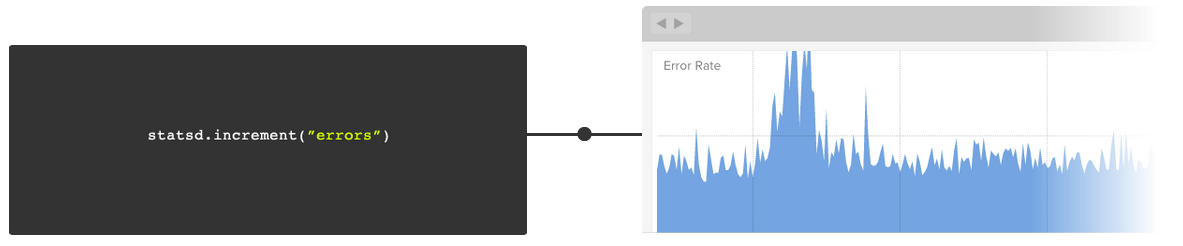
...which gives you ready-to-go charts and alerting (ex: alert when the error rate exceeds 50 errors/min).
Get started with StatsD today!
Additional resources to get you started:
- Our presentation at the Boulder DevOps Meetup
- Monitoring Docker events with StatsD
- Rails/Rack gem for StatsD
- Django extension for StatsD
Questions? Comments? Contact us at support@scoutapm.com.
More updates on StatsD? Follow us on Twitter.


