Debugging request bottlenecks with realtime charts
Last week, one of our application servers died. We have four app servers, so in theory, the death of one app server shouldn't bring the entire platoon down. However, real-life had other plans: 95% of requests were handled fine, but around 5% were being dropped. Here's the story of how we diagnosed and fixed the issue with our realtime charts.
The Problem
Our web stack looks like this: A web server running HAProxy (using Apache to process HTTPS requests), which then uses round-robin load balancing to send requests to four app servers running Apache + Passenger.
One of our customers reported seeing sporadic "503 Service Temporarily Unavailable" errors in their web browser. From experience, we know this typically means HAProxy is unable to handoff a request to an app server.
1. How frequent are 503 errors?
We scanned our load balancer access logs and checked for the number of 503 errors. There were a lot of 503s:
BIG NUMBER
Not good. Next, a quick sanity check. Did we get this many 503s before the app server went out of rotation?
SMALL NUMBER
Thankfully, no. This was a pretty good sign the 503s were tied to a bottleneck with the loss of the app server.
2. Can we identify the bottleneck by watching request activity in realtime?
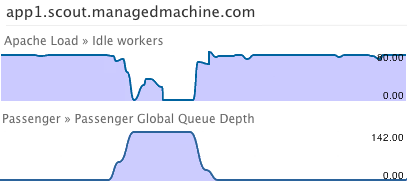
I fired up a realtime chart session, fetching the following metrics from each app server:
- Apache Available Workers
- Passenger Global Queue Depth
Passenger was showing a rise in the Global Queue Length and Apache Available Workers were dropping to zero. Because the global queue depth was so high, we knew the bottleneck was at the application server (Passenger) and not the web server (Apache).
3. When is the queue spiking?
The chart showed that the vast majority of requests were bunched between 20-30 seconds. Why?
Originally, every Scout agent would checkin on the minute. This resulted in an inefficent request profile: virtually all requests to scoutapm.com occurred between 1-7 seconds. We then added a modifiable variable sleep - later agents reported to scoutapm.com between 15-30 seconds. This spread out the request volume (older agents report close to on the minute, new versions a bit later).
Today, almost all agents are checking in w/an agent version that supports the sleep interval. This means the bunching just moved to later time period. The fix: re-balance the checkins. We adjusted the sleep interval on the agents to be between 0-30 seconds, not just 15-30 seconds.
4. Did it work?
We simulated a dead app server by removing one from our HAProxy configuration and fired up a realtime chart session. With the request distribution spread fairly evenly from 0-30 seconds, there were zero 503s:
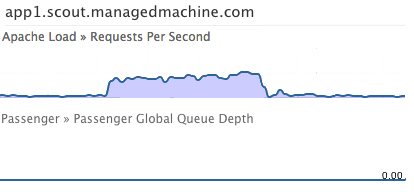
Nice. Finally, we added a trigger to alert us in the future when the rate of 503 errors dramatically increases.