Understanding Disk I/O: When Should You Be Worried?
 Derek Haynes
on
June 30, 2019
Derek Haynes
on
June 30, 2019
Updated version of an article first published on February 10th, 2011.
If you’re old enough to remember floppy drives, you’ve heard the symptoms of a disk I/O bottleneck. For example, while Oregon Trail loaded the next scene, you’d hear the drive grinding away, reading data from the disk. The CPU would sit idle during this time, twiddling its fingers waiting for data. If that floppy drive was faster, you'd be running the Columbia River rapids by now.
It’s more difficult to detect an I/O bottleneck if the disk isn’t on your desktop. I’ll look at four important
- Do you have an I/O bottleneck?
- What impacts I/O performance?
- What’s the best path to fixing an I/O bottleneck?
- How do you monitor disk I/O?
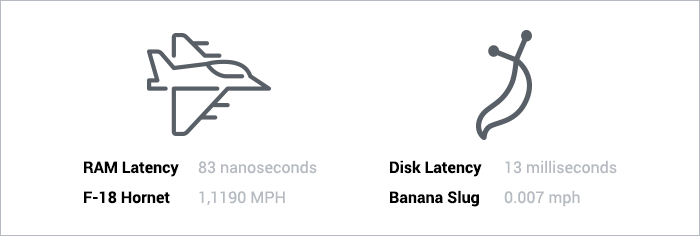
A banana slug vs. an F-18 Hornet
Disk I/O encompasses the input/output operations on a physical disk. If you’re reading data from a file on a disk, the processor needs to wait for the file to be read (the same goes for writing).
The killer when working with a disk? Access time. This is the time required for a computer to process a data request from the processor and then retrieve the required data from the storage device. Since hard disks are mechanical, you need to wait for the disk to rotate to the required disk sector.
Disk latency is around 13ms, but it depends on the quality and rotational speed of the hard drive. RAM latency is around 83 nanoseconds. How big is the difference? If RAM was an F-18 Hornet with a max speed of 1,190 mph (more than 1.5x the speed of sound), disk access speed is a banana slug with a top speed of 0.007 mph.
This is why caching data in memory is so important for performance – the difference in latency between RAM and a hard drive is enormous*.
Do you have an I/O bottleneck?
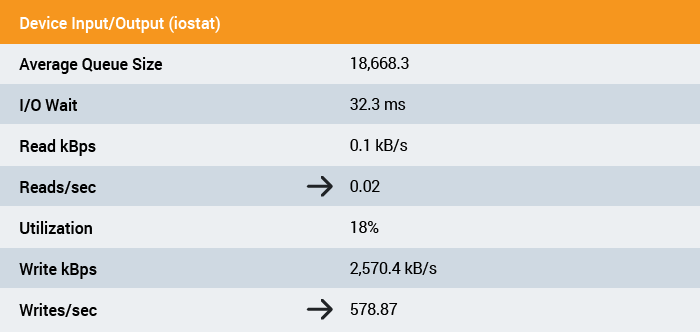
Your I/O wait measurement is the canary for an I/O bottleneck. I/O Wait is the percentage of time your processors are waiting on the disk.
For example,
The disk is being accessed while the rows are
You can check your I/O top
If your I/O wait percentage is greater than (1/# of CPU cores) then your CPUs are waiting a significant amount of time for the disk subsystem to catch up.
In the output above, I/O wait is 12.1%. This server has 8 cores (via cat /proc/cpuinfo). This is very close to (1/8 cores = 0.125). Disk access may be slowing the application down if I/O wait is consistently around this threshold.
What impacts I/O performance?
For random disk access (a database, mail server, file server, etc), you should focus on how many input/output operations can be performed per-second (IOPS).
Four primary factors impact IOPS:
- Multidisk Arrays – More disks in the array mean greater IOPS. If one disk can perform 150 IOPS, two disks can perform 300 IOPS.
- Average IOPS per-drive – The greater the number of IOPS each drive can handle, the greater
the the total IOPS capacity. This is largely determined by the rotational speed of the drive. - RAID Factor – Your application is likely using a RAID configuration for storage, which means you’re using multiple disks for reliability and redundancy. Some RAID configurations have a significant penalty for write operations. For RAID 6, every write request requires 6 disk operations. For RAID 1 and RAID 10, a write request requires only 2 disk operations. The lower the number of disk operations, the higher the IOPS capacity. This article has a great breakdown on RAID and IOPS performance.
- Read and Write Workload – If you have a high percentage of write operations and a RAID setup that performs many operations for each
write request (like RAID 5 or RAID 6), your IOPS will be significantly lower.
Calculating your maximum IOPS
A more exact way to determine just how close you are to your maximum I/O throughput is to calculate your theoretical IOPS and compare it to your actual IOPS. If the numbers are close, there may be an I/O issue.
You can determine theoretical IOPS via
| I/O Operations Per-Sec = | number of disks * Average I/O Operations on 1 disk per-sec |
| % of |
All but one of the pieces in this equation can be determined from your hardware specs. You’ll need to figure out the read/write workload though – it’s application dependent. For this, use a tool like
Once you’ve calculated your theoretical IOPS, compare it to tpssartpstps
Check out a more detailed calculation of IOPS.
What’s the best path to fixing an I/O bottleneck?
Even if a banana slug follows all of the tips in The 4 Hour Body, it will never be as fast as an F-18 Hornet. Likewise, you can tune your disk hardware for better performance, but it’s complicated and will not approach the speed of RAM.
If you’re hitting a disk I/O bottleneck now, tuning your hardware likely isn’t the fastest remedy. Hardware changes likely involve significant testing, data migration, and communication between application developers and
When we see I/O bottlenecks at the Blue Box Group, we first try to tweak the service that’s using the most I/O and cache more of its data in RAM. For example, we usually configure our database servers to have as much RAM as possible (up to 64 GB or so), and then have MySQL cache as much as possible in memory.
Three takeaways
- Disk access is
slooowww – Disk access speeds do not come close to approaching RAM. - Optimize your apps first – Tuning your disk hardware isn’t trivial or likely to be a quick fix. Try to have your I/O-heavy services read more data from a RAM cache first.
- Measure – Modifications to your application can have a big impact on Disk I/O. Record the key I/O metrics over time.
More servers? Or faster code?
Adding servers can be a band-aid for slow code. Scout APM helps you find and fix your inefficient and costly code. We automatically identify N+1 SQL calls, memory bloat, and other code-related issues so you can spend less time debugging and more time programming.
Ready to optimize? Sign up for a free trial.
Also See
- How much slower is Disk vs. RAM latency?
- Calculate IOPS in a storage array. This provides a more detailed walkthrough on IOPS.
- Analyzing I/O Performance In Linux
- What Your Computer Does While You Wait. A great walk-through of interactions between various subsystems of a computer. Understandable for non-sysadmins.
Subscribe to our RSS feed or follow us on Twitter for more.
* - If the difference between RAM and disk latency seems striking to you, it should -- it's a massive difference in performance. If it doesn't jibe with your day-to-day experience with your computer, keep in mind three things: 1) 13ms is the time for a hard drive seek -- if you're reading contiguous data from an unfragmented file, then the hard drive's *transfer rate* (not the seek speed) comes to bear. 2) 13ms is still extraordinarily fast by human standards. 3) There are multiple mechanisms in place to ameliorate the impact of hard drive's dismal performance, like paging, write-queuing, and HD-resident cache.


